

A report’s averages may look acceptable even when a brief disturbance disrupts equipment. To understand how to read a power quality analysis report, match each measurement to the relevant standard, identify events and trends, and relate them to system and equipment behavior. This turns charts and tables into useful evidence.
If the report feels dense, that’s understandable: its summary may combine measurements, waveforms, and recorded events. Read each result in context rather than treating one number as the whole story.
This guide explains how to choose relevant standards, interpret voltage variations and harmonics, and use power system analysis to connect findings with operating conditions. You’ll have a clearer path from technical data to informed next steps.
Key Takeaways
- Choose assessment standards that match the measurement location and the power quality issue being investigated.
- Read waveforms, event records, and summary values together to see how disturbances may affect equipment.
- Use power system analysis to connect trends in voltage, current, harmonics, and power factor with operating conditions.
- When power interruptions or harmonic concerns need attention, consider how Uninterruptible Power Supplies (UPS) or Harmonic Analysis may fit your needs.
Choosing the applicable assessment and measurement standards
Start by matching the assessment standard to the network and the measurement method to the question. The right reference makes results comparable and helps connect a recorded disturbance with a practical response.
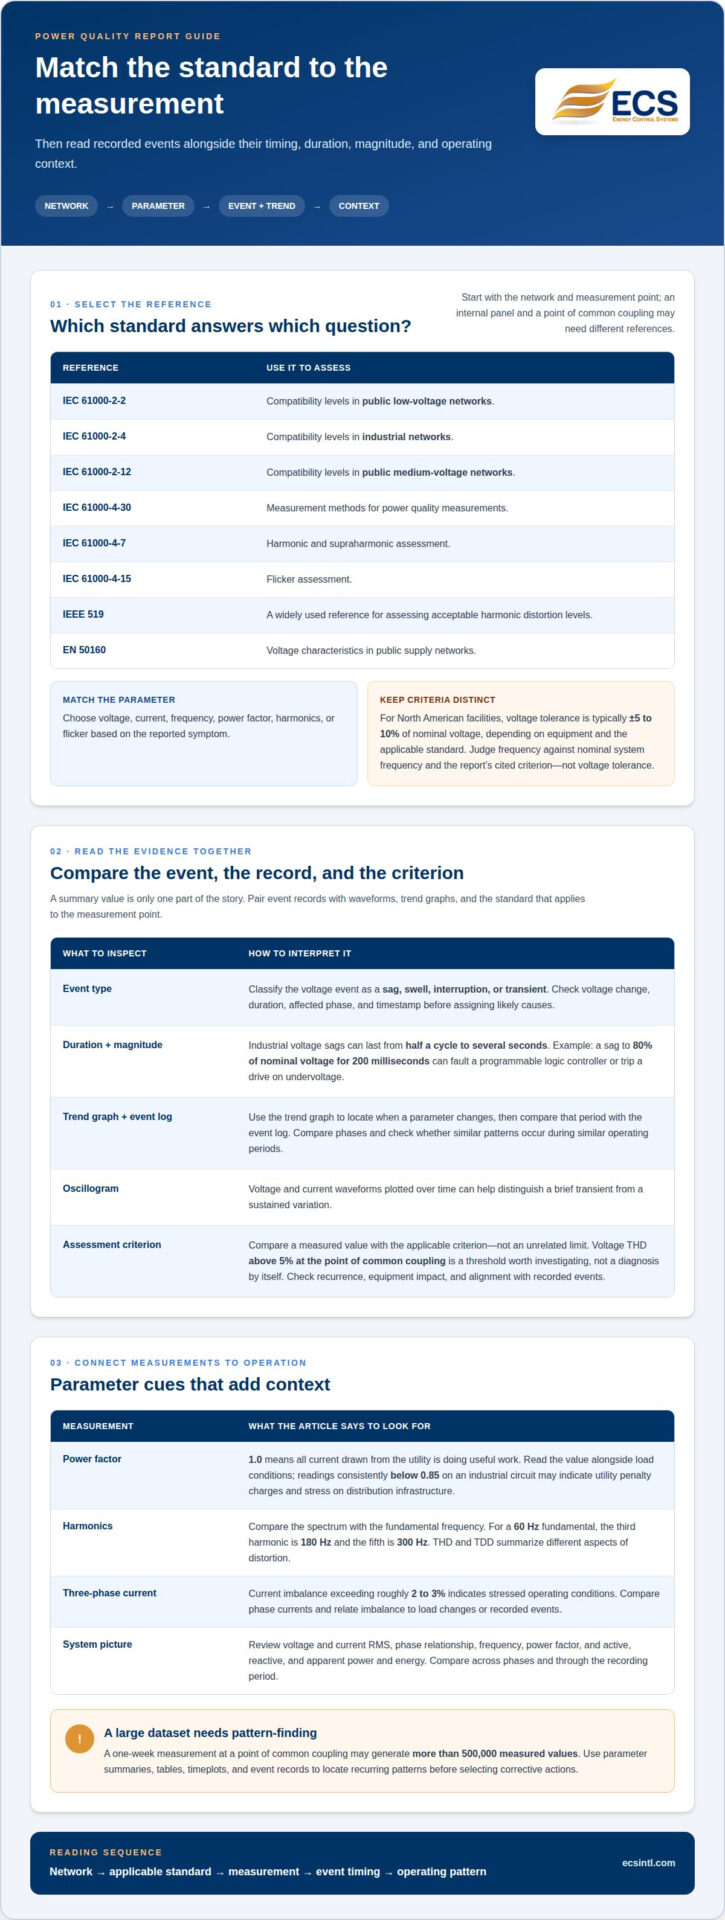
- Identify the network and assessment point. IEC 61000-2-2 defines compatibility levels in public low-voltage networks; IEC 61000-2-4 addresses industrial networks. For public medium-voltage networks, IEC 61000-2-12 defines compatibility levels. A point of common coupling and an internal production panel may therefore need different assessment references.
- Choose the measurement method. IEC 61000-4-30 specifies measurement methods for power quality measurements, according to the International Electrotechnical Commission (IEC). For harmonic and supraharmonic assessment, IEC 61000-4-7 is relevant, according to the International Electrotechnical Commission (IEC). For flicker, consider IEC 61000-4-15.
- Match the standard to the parameter. Select voltage, current, frequency, power factor, harmonics, or flicker based on the reported symptom. IEEE 519 is widely used to assess acceptable harmonic distortion levels. In public supply networks, EN 50160 describes voltage characteristics.
- Read voltage and frequency criteria in context. In North American facilities, acceptable voltage tolerance is typically plus or minus 5 to 10 percent of nominal voltage, depending on equipment and the applicable standard. Judge frequency against the nominal system frequency and the criterion cited in the report, rather than applying voltage tolerance to it.
- Check the report’s contents and dataset. A power quality report summarizes power conditions, recorded events, and possible corrective actions. Look for measurement setup, parameter summaries, event records, timeplots, and conclusions. A one-week measurement at a point of common coupling may generate more than 500,000 measured values, so use tables and timeplots to locate recurring patterns before selecting corrective actions.
Interpreting results and standards-based assessments
Read each recorded event alongside its duration, magnitude, and timing. Then compare it with the standard that applies to the measurement point and electrical system.
-
Classify Voltage Events
First, identify whether the event is a sag, swell, interruption, or transient. Check the voltage change, duration, affected phase, and timestamp before assigning likely causes. Industrial voltage sags can last from half a cycle to several seconds, so a brief event may still matter. For example, a sag to 80 percent of nominal voltage lasting 200 milliseconds can fault a programmable logic controller or trip a drive on undervoltage.
-
Read Trend Graphs and Event Details
Use the trend graph to locate when a parameter changes, then compare that period with the event log. An oscillogram plots voltage and current waveforms over time, helping distinguish a brief transient from a sustained variation. Compare phases and look for patterns during similar operating periods. Power quality recorders may display data in time plots and tables; reading both helps connect an event’s shape with broader system behavior.
-
Assess Results Against Standards
Finally, compare the measured value with the applicable assessment criterion, not an unrelated limit. In public electricity supply networks, EN 50160 describes voltage characteristics, while IEC 61000-2-2 defines compatibility levels in public low-voltage networks. Treat voltage THD above five percent at the point of common coupling as a threshold worth investigating, not as a diagnosis by itself. Check whether the result recurs, affects equipment, or aligns with recorded events before considering corrective action.
Power system analysis
Knowing how to read a power quality analysis report means connecting measured values with operating conditions. The report may summarize system conditions, recorded events, and possible corrective actions, but patterns across parameters give those findings context.
- Build a parameter picture. Review voltage and current RMS, phase relationship, frequency, power factor, and active, reactive, and apparent power and energy. Compare the readings across phases and through the recording period. This helps distinguish a single unusual value from a pattern affecting the electrical system.
- Interpret power factor in context. A power factor of 1.0 means all current drawn from the utility is doing useful work. Read the value alongside load conditions. Readings consistently below 0.85 on an industrial circuit may indicate utility penalty charges and stress on distribution infrastructure.
- Trace harmonic components. Compare the spectrum with the fundamental frequency. For a 60 Hz fundamental, the third harmonic is 180 Hz and the fifth is 300 Hz. THD and TDD summarize different aspects of distortion. Harmonic Analysis can help assess this part of the report.
- Check phase balance before troubleshooting. On a three-phase system, current imbalance exceeding roughly two to three percent indicates stressed operating conditions. Compare phase currents and relate imbalance to load changes or recorded events before deciding what to investigate.
- Turn patterns into next steps. Use timeplots, tables, and event records together. Low power factor, elevated harmonic components, and phase imbalance suggest different investigation paths. Understanding how to read a power quality analysis report helps you focus on the pattern that matters. Review harmonic analysis options when the spectrum indicates harmonic distortion needs attention.
Energy Control Systems: Uninterruptible Power Supplies (UPS)
Energy Control Systems offers Uninterruptible Power Supplies (UPS) for organizations evaluating power interruptions and continuity needs. A report that records interruptions can show where continuity planning needs attention; affected equipment and operating requirements help shape the decision.
If the analysis points to harmonic distortion, Energy Control Systems’ Harmonic Analysis can clarify the findings and inform next steps. UPS systems address interruption planning, while Harmonic Analysis focuses on harmonic conditions. Let the report’s evidence guide which issue needs attention first.
Share your power quality concerns with Energy Control Systems to discuss a suitable next step.
Turn your findings into a clear next step
A useful report gives your team a basis for prioritizing action, documenting concerns, and deciding what needs closer attention. Knowing how to read a power quality analysis report helps you bring focused questions to planning conversations instead of reacting to isolated readings. When dealing with mission-critical IT environments, collaborating with experts like Data Center Specialists (M) Sdn Bhd (DCS) can help translate power quality data into robust operational resilience.
For power quality needs, Energy Control Systems offers advanced surge protection devices, Uninterruptible Power Supplies (UPS), and comprehensive Harmonic Analysis. The right option depends on what the analysis identifies and the role of the affected equipment in your operation.
When you’re ready to discuss your power quality concerns and possible next steps, contact Energy Control Systems. A clearer understanding of your system is a strong place to begin.
Frequently Asked Questions
How do you interpret voltage, current, frequency, and power factor readings in a power quality report?
Compare each reading with the system’s nominal values, applicable limits, and operating conditions. Check minimum, average, and maximum values, then compare phases and timestamps. A low average current, for example, may hide a brief peak, while a frequency trend can reveal whether a change coincided with an equipment issue. Interpret power factor alongside load and other measurements.
How do you read voltage sag, swell, interruption, and transient event data?
Read each event’s start time, affected phase, voltage magnitude, and duration together. A sag or swell is a temporary voltage change; an interruption is a loss of supply, while a transient is a brief, rapid disturbance. Match the event time with equipment alarms or process records to see whether the disturbance coincided with a fault or operational interruption.
How do you interpret harmonics and total harmonic distortion (THD) measurements?
Use the harmonic spectrum to see which frequency components contribute to distortion, then read THD as an overall indicator of voltage or current waveform distortion. Check whether the report shows voltage THD, current THD, or total demand distortion (TDD), because these refer to different measurements. Compare readings from the same measurement point and operating conditions to avoid conclusions based on mismatched data.
What do power quality report graphs, waveforms, and event logs show?
Graphs show how measured values change over time, while waveforms display voltage and current shape during a selected interval. Event logs record disturbances with timestamps and details. Use timestamps to align a waveform with a trend graph or operating log. A recurring change during a process cycle, for example, may indicate a repeatable condition worth investigating.
How can you identify the cause of power quality problems from report data?
Look for patterns in timing, location, affected phases, and measured parameters rather than assigning a cause based on one reading. Compare event timestamps with process changes, equipment alarms, and load behavior. If disturbances appear on one branch but not elsewhere, that can help narrow the investigation. Treat the report as troubleshooting evidence, not proof of a single cause.

Article by
Jeff Edwards
Founder of ECS International Inc. Edwards travels and speaks extensively in Latin America, Asia and Africa on the subject of power quality; transients and mitigating their impact on profitability. After graduating from Texas Tech University in Lubbock Texas, Edwards spent 9 years in the Telecommunications sector prior to founding Energy Control Systems in 1987 as a Texas based corporation selling surge suppression and UPS systems. The company has evolved into a global power quality products and energy efficiency concern with operations spanning South America, Asia, Europe and Africa.
Disclaimer
Some of the above information may be the opinion of the author.