

You’re standing on the factory floor at 2 AM, staring at a PLC that just tripped for the third time this week. There’s no smoke, no blown fuse, and no obvious reason for the failure. It’s a haunting feeling. These ghost errors don’t just cause downtime; they steal your peace of mind and erode your professional confidence. You shouldn’t have to guess why your equipment is failing prematurely. We understand the weight of that frustration. It’s time for clarity.
By mastering the art of interpreting power quality analysis results, you can finally uncover the subtle electrical noise that erodes your operational tranquility. We’ll show you how to translate complex waveforms into a roadmap for total system stability. Identify the invisible transients standard protectors miss and gain the respect you deserve for solving chronic plant issues. Let’s restore your agency and protect your facility’s future.
Key Takeaways
- Identify the hidden voltage sags and high-frequency transients that bypass standard fuses to cause those frustrating, unexplained equipment resets.
- Learn how interpreting power quality analysis results allows you to detect harmonic distortions from VFDs before they overheat your transformers and trip your breakers.
- Understand the critical impact of IEEE 519 standards and why managing “dirty power” is the secret to restoring your personal agency and professional status.
- Transition from raw data to a permanent solution by using Harmonic Analysis as your diagnostic guide and the SineTamer LA Series as your facility’s ultimate shield.
Understanding the Language of Disturbance: Sags, Swells, and Transients
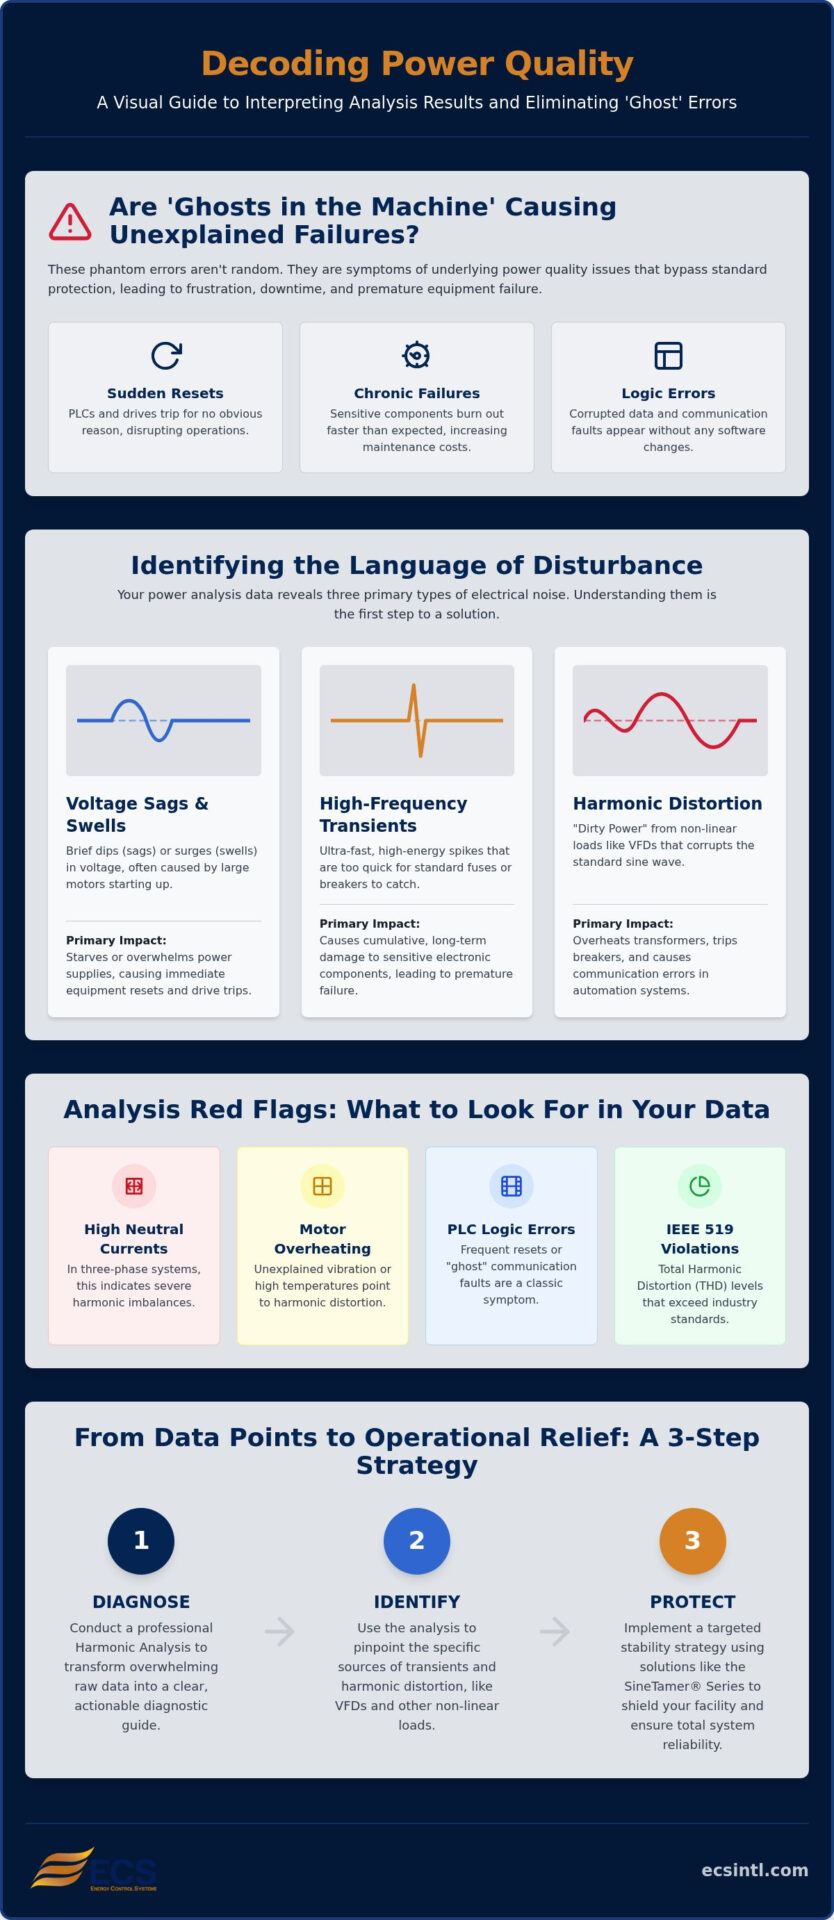
Voltage sags and swells are the most common culprits behind sudden, frustrating equipment resets. A sag is a momentary dip in voltage, often caused by large motors starting up nearby. Conversely, a swell is a brief surge. When your PLC unexpectedly reboots or a drive trips for no apparent reason, these fluctuations are usually to blame. They starve or overwhelm your power supplies, leaving you to deal with the operational fallout.
Transients are far more deceptive. In your data, they appear as sudden, high-frequency “notches” or “spikes” that occur in microseconds. Because they happen so fast, standard fuses and thermal breakers don’t even blink. They bypass traditional protection and strike directly at the heart of your sensitive electronics. These anomalies are the “ghosts in the machine” that cause unexplainable downtime and rob you of your productivity. We understand the anxiety of chasing errors that shouldn’t exist. It’s exhausting.
The Difference Between Event Triggers and Baseline Noise
When you begin interpreting power quality analysis results, it’s easy to focus only on the massive, catastrophic events. However, looking only at major triggers misses the silent destruction caused by chronic baseline noise. This constant stream of low-level transients creates excessive heat and cumulative stress on sensitive components like surge protective devices. If your protection isn’t designed to filter this noise, it will eventually degrade and fail.
Transient voltage is essentially a high-speed pressure wave that erodes electronic junctions over time. It doesn’t always kill a machine instantly; instead, it weakens the system until a minor event causes a total collapse. By identifying these patterns early while interpreting power quality analysis results, you can stop the erosion and restore stability to your facility.
Identifying the Silent Killers: Interpreting Harmonics and Waveform Distortion
Harmonics are the silent thieves of industrial efficiency. While a surge is a sudden attack, waveform distortion is a slow, agonizing burn. When interpreting power quality analysis results, you must look closely at Total Harmonic Distortion (THD). If these levels exceed IEEE 519 limits, you’re dealing with “dirty power” that forces your equipment to work harder for less output. Non-linear loads like Variable Frequency Drives (VFDs) are often the primary source. They generate harmonic currents that overheat transformers and cause breakers to trip without a physical overload. It’s a frustrating cycle that wears down both your machinery and your maintenance team.
This distortion does more than generate heat. It poisons your industrial automation systems. Corrupted waveforms lead to “ghost” communication errors in PLCs. This leaves you scrambling to find software faults that simply aren’t there. It’s a massive waste of your time and your talent. We believe you deserve a facility that runs predictably.
Analyzing the Impact on Sensitive Electronic Infrastructure
When you’re interpreting power quality analysis results, look for these specific red flags in the data:
- High neutral currents in three-phase systems.
- Unexplained motor vibration or overheating.
- Frequent “logic errors” or resets in digital controllers.
The SineTamer RM Series is specifically designed to filter out the frequencies that cause these digital failures. It acts as a protective shield for your rack-mounted assets. Also, watch for “cross-talk” in your data cables. High-frequency noise often jumps from power lines to communication lines, corrupting your data packets. A professional Harmonic Analysis can pinpoint these leaks, giving you the actionable evidence needed to secure your facility’s stability.
From Data Points to Operational Relief: Implementing a Stability Strategy
Raw data is often overwhelming; it’s a chaotic collection of waveforms and error codes that can leave you feeling powerless. However, that data is actually your path to tranquility. You don’t have to stay trapped in a cycle of reactive repairs. A professional Harmonic Analysis serves as the essential bridge between recognizing a problem and fixing it forever. By interpreting power quality analysis results with a focus on restoration, you transform technical noise into a structured roadmap for success. This isn’t just about machinery. It’s about restoring your agency and securing your reputation as the problem-solver who finally brought peace to the facility.
When you use these findings to justify a SineTamer installation, you’re making a data-backed case for long-term survival. You aren’t just buying hardware; you’re investing in a stress-free work environment. We’ve seen how this clarity empowers engineers to lead their organizations with confidence. You deserve to walk into your plant knowing the “ghosts” are gone for good.
Leveraging Site Analysis for Long-Term Equipment Survival
A technical site analysis provides the tactical map for your facility’s defense. It identifies the exact placement for SineTamer LA Series units to maximize protection against the transients revealed in your reports. While the SineTamer handles the high-speed noise, an Uninterruptible Power Supply (UPS) remains critical for maintaining total uptime during the sags and interruptions found while interpreting power quality analysis results.
Adopting this proactive, battle-tested approach prevents the next crisis before it starts. It shifts your focus from firefighting to system optimization. By integrating the right protection at the right points, you create a stable technological landscape that survives the harshest electrical environments.
Securing Your Path to Operational Peace of Mind
You don’t have to accept unexplained downtime as an unavoidable industrial tax. By interpreting power quality analysis results, you’ve moved from confusion to a position of absolute strength. You now understand how voltage sags disrupt your workflow and how high-frequency transients silently erode your sensitive electronics. This clarity is the first step toward a facility that runs with predictable, quiet efficiency.
We’ve spent over 35 years as a battle-tested partner for global plants and local Fort Worth operations. Our SineTamer LA Series is the global standard for industrial transient protection, specifically designed to eliminate the noise that standard devices miss. It’s time to reclaim your agency and your professional status. Request a Professional Harmonic Analysis to Restore Your Facility’s Stability. You deserve the tranquility of a system that works exactly as it should.
Frequently Asked Questions
What is the most critical metric to look for in power quality analysis results?
Total Harmonic Distortion (THD) is often the most revealing metric for your facility’s long-term health. While a single spike is easy to spot, THD measures the cumulative “dirty power” that overheats your motors and transformers. When you’re interpreting power quality analysis results, pay close attention to voltage transients. These high-speed pressure waves cause the “ghost” errors that disrupt your automation and steal your peace of mind.
How do I know if my harmonic distortion levels are dangerous for my facility?
You should compare your facility’s data directly against the current IEEE 519 standards. If your Total Harmonic Distortion levels exceed these documented limits, your infrastructure is in a danger zone. High harmonics lead to excessive heat in neutral conductors and sensitive VFD components. Ignoring these numbers means accepting a higher risk of catastrophic equipment failure and expensive, unpredicted downtime.
Can low-level transients be seen on a standard multimeter?
No, a standard multimeter cannot capture low-level transients because they occur in microseconds. These events happen far too fast for the sampling rate of common handheld tools. Effectively interpreting power quality analysis results requires high-speed monitoring equipment that can “see” these high-frequency notches. Without specialized tools, these silent killers remain invisible until your PLC or SCADA system suddenly fails without warning.
What happens if I ignore the sags and swells found in my report?
Ignoring these events leads to a cycle of chronic equipment resets and lost production data. Sags and swells are physical stressors that starve or overwhelm your power supplies, causing sensitive components to degrade prematurely. Over time, this neglect turns manageable issues into total system collapses. It’s a heavy psychological burden for any maintenance team to carry when a permanent solution is within reach.

Article by
Jeff Edwards
Founder of ECS International Inc. Edwards travels and speaks extensively in Latin America, Asia and Africa on the subject of power quality; transients and mitigating their impact on profitability. After graduating from Texas Tech University in Lubbock Texas, Edwards spent 9 years in the Telecommunications sector prior to founding Energy Control Systems in 1987 as a Texas based corporation selling surge suppression and UPS systems. The company has evolved into a global power quality products and energy efficiency concern with operations spanning South America, Asia, Europe and Africa.
Disclaimer
Some of the above information may be the opinion of the author.